An AI visibility dashboard is a standing view of how often AI answers name your brand, against which competitors, on which topics, and citing which sites. This guide shows how to build one in A2ZReach, using an example account.
Your web analytics cannot tell you whether ChatGPT named your brand this week. That is the gap a dashboard closes: it is built from many tracked prompts run over time, not from one check. By the end of this guide you will know what each widget tells you and what to do with it.
What Is an AI Visibility Dashboard?
An AI visibility dashboard is a standing, multi-prompt view of how your brand appears in AI-generated answers. It is not a one-off check or a web analytics report.
Web analytics shows you traffic after someone clicks. A one-off check shows you one answer from one engine at one moment. Neither tells you whether the brand is named, recommended, compared or absent across the questions buyers actually ask. The dashboard does.
In A2ZReach, this view is the "GEO & Answer Engine Insights" page. At the top, your brand name appears with the tag "ACTIVE ASSET." Below it sit five tabs: "Visibility," "Prompts," "Query Fanouts," "Platforms" and "Citations." Filters under the tabs (date range, granularity, "Topics" and "Platforms") apply to the widgets on the page.
Why Should You Build an AI Visibility Dashboard?
Buyers research with AI, single answers vary from run to run, and answers cite several sources, so one check misleads and a standing view does not.
People now research with AI, and the shortlist forms there. A Pew Research Center survey (opens in a new tab) of 5,119 U.S. adults (February 2026) found that about half of U.S. adults now use AI chatbots (49%, up from 33% in 2024, though the comparison is not exact because the 2024 question was asked only of people who had heard of chatbots), and about 42% say they use chatbots to search for information. These are self-reported answers, not measured behavior. A Gartner survey (opens in a new tab) of 377 U.S. consumers (June and July 2025) found that 31% consider more product options because of AI overviews, against 7% who consider fewer. Our reading: if buyers now meet a shortlist inside an AI answer, a brand missing from those answers is missing from the shortlist.
One check misleads. Tracking many prompts over time does not. SparkToro's January 2026 research (opens in a new tab) had about 600 volunteers run 12 prompts through ChatGPT, Claude and Google's AI a combined 2,961 times (responses collected in November and December 2025; the work was not peer-reviewed, and a co-author works for an AI-tracking company). It found less than a 1-in-100 chance that ChatGPT or Google's AI gives the same list of brands in any two responses to the same prompt, and about 1 in 1,000 for the same order. The authors conclude that a visibility percentage across dozens to hundreds of prompts run multiple times is a reasonable metric, while a single ranking position is not. A dashboard built on repeated runs across many prompts is how you deal with that variability.
Answers cite several sources, so you need to see which ones. A March 2025 Pew study (opens in a new tab) of 900 U.S. adults found that 88% of Google's AI summaries cited three or more sources and only 1% cited a single source. Our reading: being one of the cited sources is part of the outcome, and web analytics will not show you that.
What Does an AI Visibility Dashboard Give Your Team?
It shows whether AI answers mention, recommend, compare or leave out your brand, how you stand against competitors, and which sites the engines cite.
The AI visibility metrics in A2ZReach come from what the product does: for each prompt and engine, it records whether the brand was mentioned, recommended, compared or absent. It measures Share of Voice against the other brands detected in the same prompt set, plus position and trend, the domains and pages cited, and competitor presence. Each metric keeps the captured answer, engine, prompt and timestamp behind it. The AI visibility tracking page describes the full set.
Here is how different roles might use it, as our reading:
- SEO lead. Reads the "Visibility Score" and the topic rankings to see which topics look weakest and which prompts to look at first.
- Content team. Uses the "Citations" tab to see which categories of site the engines cite, then checks where the brand's own domain sits in the citation rank.
Your own numbers will differ from the example account shown in this guide.
How Do You Build an AI Visibility Dashboard in A2ZReach?
Choose what to track, then read it through the Visibility, Prompts, Platforms and Citations tabs: six steps, from deciding what to measure to sharing the numbers.
Six steps, in order:
- Decide what to measure (country, competitors, topics, prompts)
- Scope the view and read your Visibility Score
- Add Share of Voice and Average Position
- Find where to work, topic by topic
- See which sites the engines cite
- Share it
There is no separate dashboard builder: the dashboard is the Answer Engine Insights page, and what it shows depends on what your account tracks, plus the tab and filters you pick.
Step 1: Decide What to Measure
Before the dashboard shows anything, you tell A2ZReach what to track. This step comes from the setup guide, not from a screen in the dashboard itself.
You enter your website URL and the country your buyers are in; prompts run as a buyer in that country would ask them. You review the business profile drafted from your website and, if you want, add locations. Then you confirm competitors: a live check against AI engines suggests the rivals they name in your market, and you keep the ones that matter, remove the rest, and add any that are missing. After that, you review topics and prompts. A topic is a group of related buyer questions; a prompt is the question A2ZReach asks AI engines on your behalf, written in natural, conversational language, the way a person would type it. You can add, remove or edit them before you continue. Then you pick a plan and start the first run. Once the first check of your prompts is in, the Home page checklist includes "Review your visibility scores."
The topics and prompts documentation advises reviewing the prompt set monthly, because buyer language evolves.
Step 2: Scope the View and Read Your Visibility Score
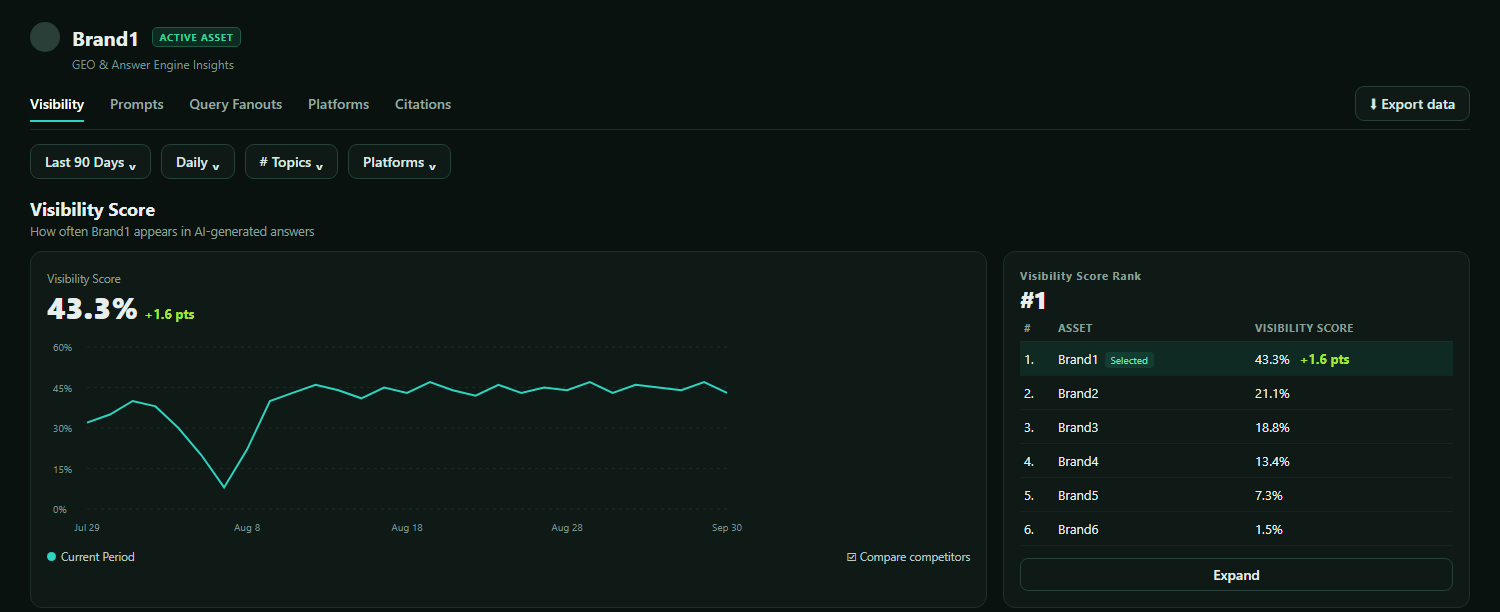
Your "Visibility Score" is the headline number. It is the percentage of AI answers, to your prompts that do not name your brand, in which your brand appears. In the example account, over 90 days, it was 43.3%, up 1.6 points.
Open the "Visibility" tab. Set the date range (the example account shows "Last 90 Days"), the granularity ("Daily," "Weekly" or "Monthly"), and use the "Topics" and "Platforms" filters to narrow or widen the view. The "Visibility Score" widget shows the headline percentage, its change in points, and a chart over the period. Tick "Compare competitors" to draw each tracked competitor as a dotted line on the same chart, with your brand's line solid.
The widget also holds the "Visibility Score Rank" table, with the columns "ASSET" and "VISIBILITY SCORE." In the example account, six brands appear: the selected brand first, tagged "Selected," at 43.3%, then 21.1%, 18.8%, 13.4%, 7.3% and 1.5%.
Step 3: Add Share of Voice and Average Position
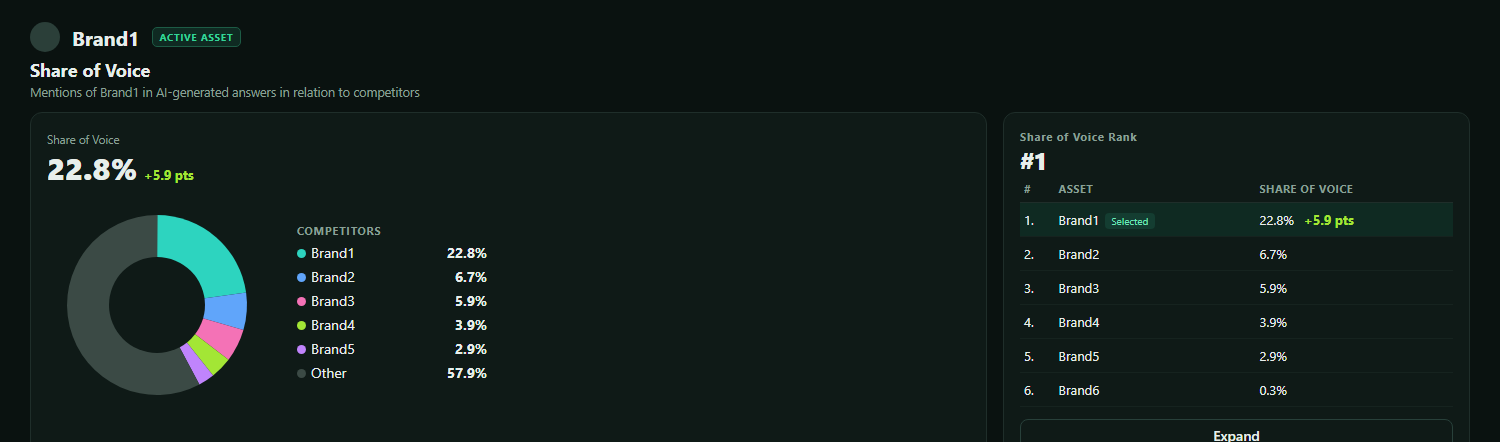
Two more widgets on the same tab give you the rest of the headline picture, including share of voice in AI search.
"Share of Voice" is described on the page as "Mentions of [your brand] in AI-generated answers in relation to competitors." In the example account it was 22.8%, up 5.9 points. The pie chart, with a legend headed "COMPETITORS," shows the brand at 22.8%, four competitors at 6.7%, 5.9%, 3.9% and 2.9%, and "Other" at 57.9%. The "Share of Voice Rank" table lists six brands.
"Average Position" is described as "Average rank of [your brand] in AI-generated answers." It shows a raw number, not a percentage. In the example account it was 2.3, with a change of -0.07. The chart's vertical axis is inverted, so a lower number sits higher up. The "Average Position Rank" table shows six brands at 2.3, 2.8, 3.0, 3.0, 4.0 and 6.0. The widget's tooltip states: "Lower numbers indicate higher/better visibility."
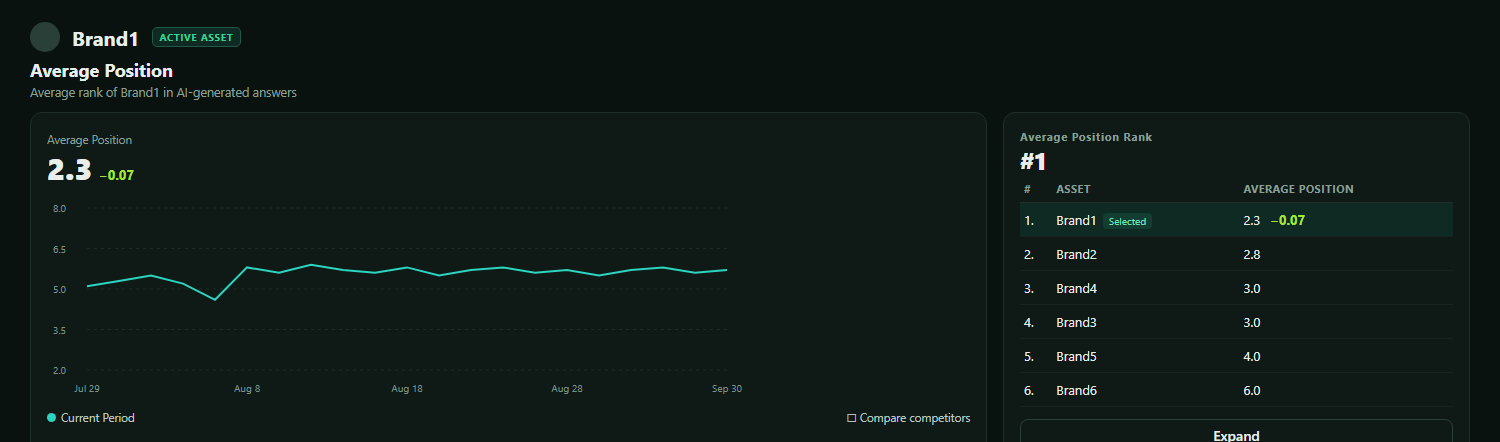
Our reading: look at the three numbers together. A high "Visibility Score" with a low "Share of Voice" would suggest the brand appears often but so do its competitors. A good "Average Position" with a low "Visibility Score" would suggest the brand ranks well when it appears but appears in too few answers.
Step 4: Find Where to Work, Topic by Topic
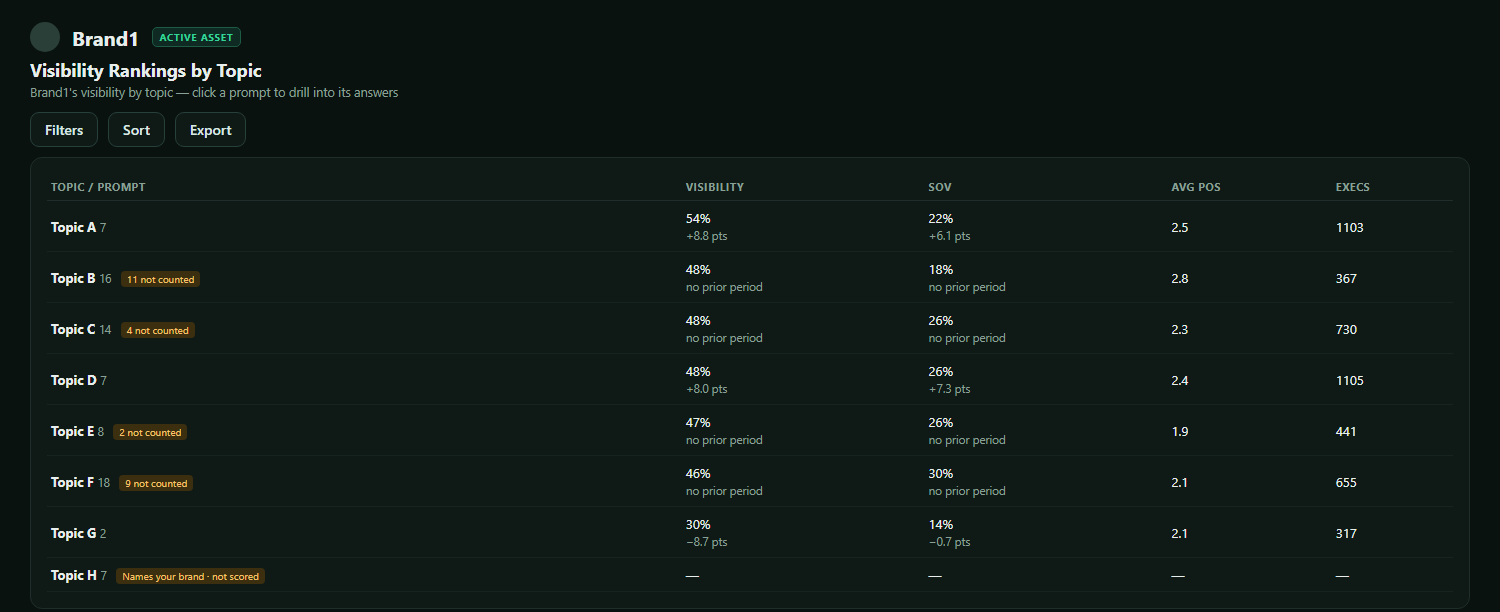
The headline numbers tell you where you stand. "Visibility Rankings by Topic" helps you decide where to look first.
Scroll down the "Visibility" tab to the section headed "Visibility Rankings by Topic." Each row is a topic, with its number of prompts and the columns "VISIBILITY," "SOV," "AVG POS" and "EXECS" (executions). The change in visibility and share of voice appears in points, or as "no prior period." In the example account, 13 topics and 132 prompts are tracked, with visibility by topic running from 21% to 54%. Use "Sort" to order the rows by visibility, share of voice, average position, executions or topic name, and "Filters" to narrow by visibility, share of voice and run count.
Some rows carry a tag such as "11 not counted." Rows tagged "Names your brand · not scored" show dashes in every column. The product's code explains the tag: a prompt that names the brand is always answered with the brand in it, so it is listed but never counted in the visibility numbers.
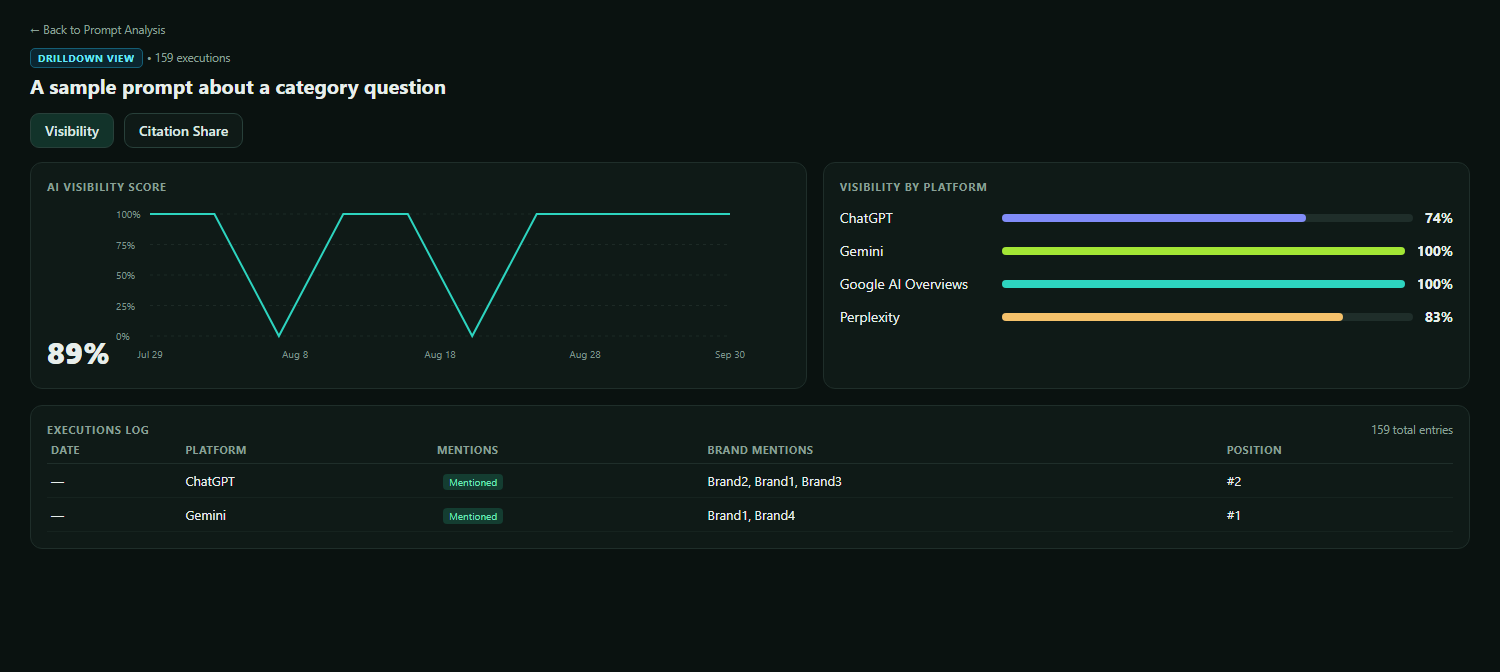
Click a topic row to see the prompts inside it, and click a prompt to open the "DRILLDOWN VIEW." In the example account, one prompt had 159 executions, an "AI VISIBILITY SCORE" of 89%, and a "VISIBILITY BY PLATFORM" card showing ChatGPT at 74%, Gemini at 100%, Google AI Overviews at 100% and Perplexity at 83%. The "EXECUTIONS LOG" lists the runs with their date, platform, mentions, brand mentions and position. Our reading: when a prompt's score is lower on one platform than the others, that platform is the place to start.
Step 5: See Which Sites the Engines Cite
The "Citations" tab shows how often your brand is cited in AI-generated answers, and which sites are cited alongside it.
Open the "Citations" tab. The "Citation Share" section shows two headline numbers: "CITATION SHARE" (8.7%, up 4.2 points in the example account) and "CITATION RATE" (36.6%, up 3.7 points), with a trend chart. The "Citation Rank" list shows the most-cited domains, with your own domain first and tagged "YOU."
The stacked bar "Citation Categories" breaks citations down by category. In the example account, 15 categories appear, with Directory at 26.6%, Brand Site at 24.4% and Institution at 14% as the three largest, and "You" at 8.7%. The "Top Citation Domains" table has the columns "RANK," "DOMAIN," "CATEGORY" and "SHARE," and shows 100 items in the example account.
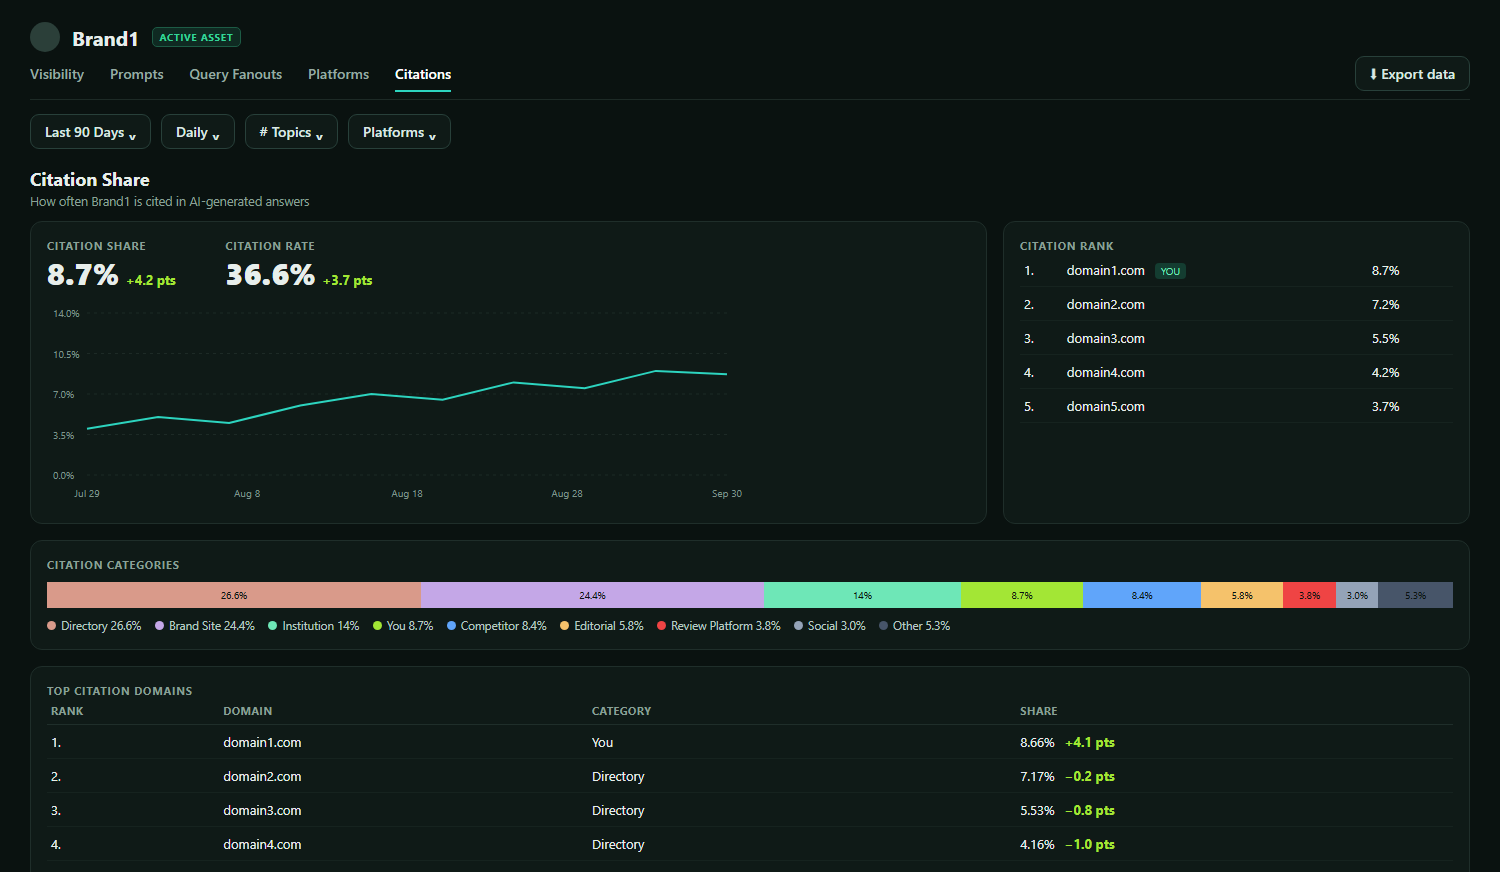
Our reading: the category breakdown shows which kinds of site are cited most for your prompts. If directories hold 26.6% of citations and your own domain 8.7%, as in the example account, directories are a kind of source worth a closer look.
Step 6: Share It
The "Export data" button at the right of the tab bar opens a menu with five options: "Export as CSV," "Export as Excel," "Export as JSON," "Copy as CSV" and "Copy as JSON." The product's code says every section follows the current filters. Each chart also has its own small download icon.
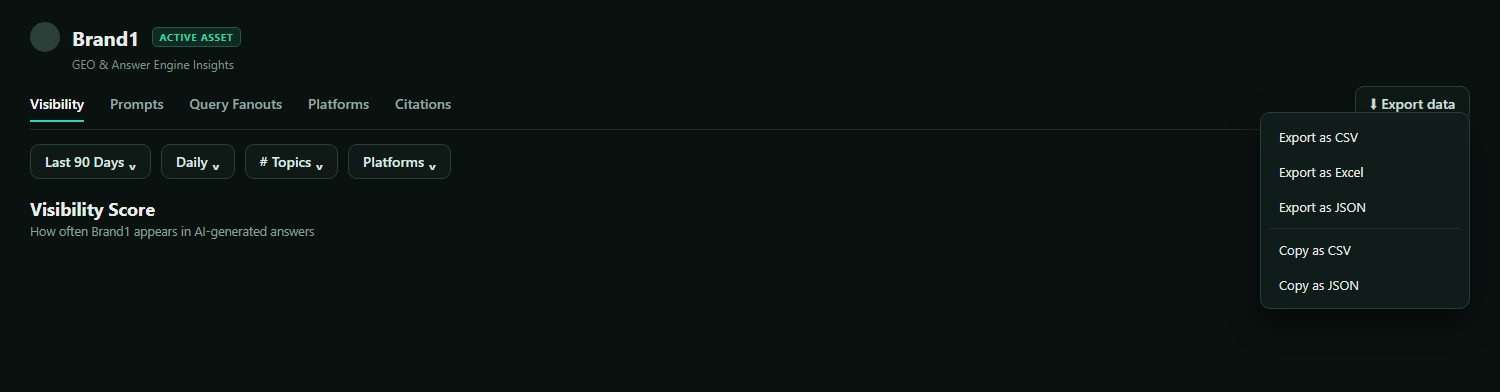
For reporting to a client or a team, our suggestion is to set the date range to the reporting period first, so the export matches the view you are presenting.
What Should You Do After You Build It?
Read the three headline numbers, pick one topic, open one of its prompts, then check citations and review the prompt set on a routine.
A routine matters more than a single read. Here is our suggestion:
- This week: Read the three headline numbers ("Visibility Score," "Share of Voice," "Average Position") for the last 30 days. Then open "Visibility Rankings by Topic," sort by visibility, and pick one topic to look at first. Open one of its prompts to see how each platform scored.
- The next few weeks: Check the "Citations" tab. See which category of site holds the largest share of citations, and compare it with where your own domain sits in the "Citation Rank" list.
- Monthly: Review the prompt set, as the topics and prompts documentation advises. Add prompts for questions that have emerged and remove ones that no longer reflect how buyers ask.
The dashboard shows you where to look first. It does not tell you what to write, and it does not guarantee a result.
FAQ
Is one check enough to know where you stand in AI answers?
No. AI answers vary from run to run. SparkToro's January 2026 research (2,961 responses to 12 prompts, not peer-reviewed, with a co-author at an AI-tracking company) found less than a 1-in-100 chance that ChatGPT or Google's AI gives the same list of brands in any two responses to the same prompt. A dashboard built on repeated runs across many prompts gives you a percentage to look at over time.
Does the dashboard change how AI answers treat my brand?
No. The dashboard is the measurement: it shows where your brand appears and where it does not, and which sites are cited. What to do with that is a decision for your team.
See Your AI Visibility Dashboard
Browse the public sample report, which is labeled "Dataset: Illustrative example, not a real measurement of any brand," to see example data in A2ZReach. When you are ready to look at your own brand, book a live demo for a 30-minute visibility review with one of A2ZReach's specialists.
- Americans and AI 2026: Chatbots, Smart Devices and Views on Impact (opens in a new tab) Pew Research Center, survey of 5,119 U.S. adults, June 17, 2026 · pewresearch.org · self-reported survey answers, not measured behavior
- Gartner Survey Finds Only One-Third of Consumers Say GenAI Rivals Search Engines (opens in a new tab) Gartner press release, Jan 20, 2026 · gartner.com · a survey of 377 U.S. consumers fielded in June and July 2025, self-reported
- New Research: AIs are highly inconsistent when recommending brands or products (opens in a new tab) SparkToro, Jan 27, 2026 · sparktoro.com · a study that is not peer-reviewed; its authors disclose a conflict of interest
- Google users are less likely to click on links when an AI summary appears in the results (opens in a new tab) Pew Research Center, July 22, 2025 · pewresearch.org · March 2025 browsing data from 900 U.S. adults, about Google's AI summaries only