Exclusion analysis shows who AI recommended instead of your brand, why it chose them, and which sites it relied on. Here is how to run one in A2ZReach.
When your brand is missing from AI answers, nothing tells you until a score drops or a customer mentions it. Exclusion analysis is the step between measuring and fixing. It takes each answer where an engine had your brand on its shortlist, then recommended someone else, and asks three questions: who took your place, why the engine chose them, and which pages it relied on. This guide shows how to run one in A2ZReach, using an example account over 15 to 21 October 2026.
What Is Exclusion Analysis?
Exclusion analysis is a focused look at the answers where an AI assistant considered your brand, then passed it over.
A Visibility Score tells you how often your brand appears: the percentage of AI answers, to your prompts that do not name your brand, in which your brand appears. It does not tell you who appeared instead, or why.
Exclusion analysis sits after that measurement. Once you know you are missing from answers, it shows the reasons the engines gave, the competitors they named and the pages they cited. It is the step before you decide what to fix.
Why Should You Run an Exclusion Analysis?
Because it turns a lost AI answer into a place to start: people research with AI, a single answer is noisy, and each lost answer shows the sources the engine cited. Here is the evidence for each.
AI answers are part of how people research now. A Pew Research Center survey of 5,119 U.S. adults (opens in a new tab) (February 17 to 23, 2026) found that about 49% now use AI chatbots, up from 33% in 2024, though Pew notes the two questions were not identical. It also found that 42% use chatbots to search for information. A Gartner survey of 377 U.S. consumers (opens in a new tab) (June and July 2025, published January 20, 2026) found that 31% consider more product options because of AI overviews, against 7% who consider fewer. We read this as: the shortlist an answer names is where consideration starts, so being absent from it is a gap worth understanding.
One answer is not a finding. A pattern is. SparkToro's January 27, 2026 research (opens in a new tab) had about 600 volunteers run 12 prompts through three AI tools, 2,961 responses in all. It found less than a 1-in-100 chance that the same AI, asked 100 times, gives the same list of brands in any two responses. The authors conclude that a visibility percentage across many prompts, run many times, is a reasonable metric, and a single ranking position is not. The work was not peer-reviewed, volunteers used default settings, and a co-author works for an AI-tracking company. So one excluded answer could be noise. The same reason appearing across days and prompts is a signal worth acting on.
A lost answer shows where to work. A March 2025 Pew study of 900 U.S. adults (opens in a new tab) found that 88% of Google AI summaries cited three or more sources, and only 1% cited a single source. We read this as: being one of the cited sources is what matters, and a lost answer shows you which sources the engine cited.
How Can Exclusion Analysis Help Your Team?
It helps three ways: you focus on real omissions, you see who appeared instead, and you connect the evidence to action.
Our feature page states these three outcomes. First, prioritize real omissions: work from measured prompts where your brand is missing, not a generic content checklist. Second, see who appeared instead: the competitors, publications and cited pages that got visibility in the captured answer. Third, connect evidence to action: the gap can inform citation targets, content briefs, comparison coverage, schema recommendations or SEO fixes.
How each role might use them is our reading, not a feature claim:
- SEO lead. The "WHY YOU LOST" table names the criteria the engine weighed against your brand. A reason that recurs across days is a better brief than a gut-feel content gap.
- Content team. The "WHAT THEY READ" card lists the sites the engines cited in the answers you lost. We read those as publications worth targeting for coverage, guest posts or PR.
- PR or partnerships. The gap types in our exclusion analysis documentation include editorial coverage (reviews and roundups that do not mention you) and review authority (expert review sites that have not reviewed your product). Both point to outreach targets.
How Do You Run an Exclusion Analysis in A2ZReach?
You run it in six steps on the "Where AI left you out" page: read the count, check that it is a pattern, find the reasons, the competitors and the sites, then pick a page to work on.
- Set the date range and read the count of excluded answers.
- Check the day-by-day bars to see whether it is a pattern or one day.
- Read card 1 for the reasons the engines gave for choosing someone else.
- Read card 2 to see which competitors took your place.
- Read card 3 for the sites the engines relied on.
- Open the action plan and pick one item to work on first.
Step 1: Set the Question and Read the Count
The page is titled "Where AI left you out." Its description reads: "Answers where an AI assistant had [your brand] on its shortlist, then recommended someone else. Here's why, who won, how it's trending, and what to fix first." Four controls at the top narrow the view: "Last 7 Days," "Topics," "Platforms" and "Export." Set the date range first. A badge then shows the number of "excluded answers."
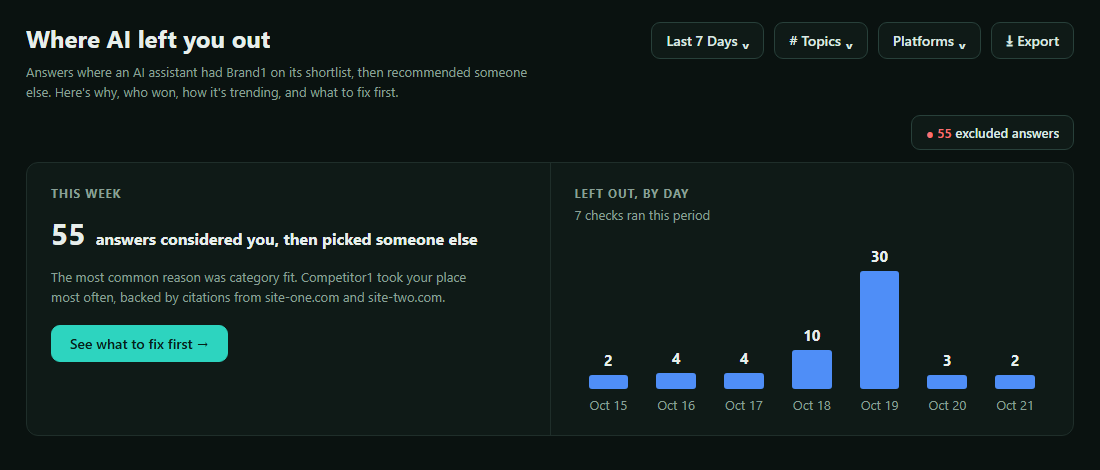
In the example account over 15 to 21 October 2026, the badge read "55 excluded answers." The summary card read "55 answers considered you, then picked someone else." A sentence under it names the most common reason and the competitor that appeared most often. A button reads "See what to fix first." Your numbers will differ.
Step 2: Check That It Is a Pattern, Not One Day
The bar chart labeled "LEFT OUT, BY DAY" shows one bar per day. Read it before anything else.
In the example account, the daily counts from October 15 to 21 were 2, 4, 4, 10, 30, 3 and 2. One day, October 19, held 30 of the 55. That spike is worth noting, but one day is not a finding. Look for reasons that repeat across several days and different prompts.
Step 3: Find Out Why the Engines Picked Someone Else
Below the summary, the section "BREAKDOWN: Why you lost, who won, and what they read" holds three cards. Card 1 is "What the engines held against you" (label "WHY YOU LOST"). It has a line chart of daily counts for up to five reasons, and a table with the columns "REASON," "OCT 21 VS OCT 20" and "COUNT." A chip, "Rising fastest," names one reason. Each row is marked "worse," "better" or "Same" against the day before. The footer reads "5 of 5 shown · untick one to swap in another," so you can compare other reasons.
In the example account over the week, the top reasons were Category Fit (12 times), Price Value (12 times, marked worse on October 21), SEO Integration (7), Citation Tracking (7) and Citation Analysis (6). Three more rows were unticked: Enterprise Analytics (5), Content Optimization (4) and Topical Authority (3).
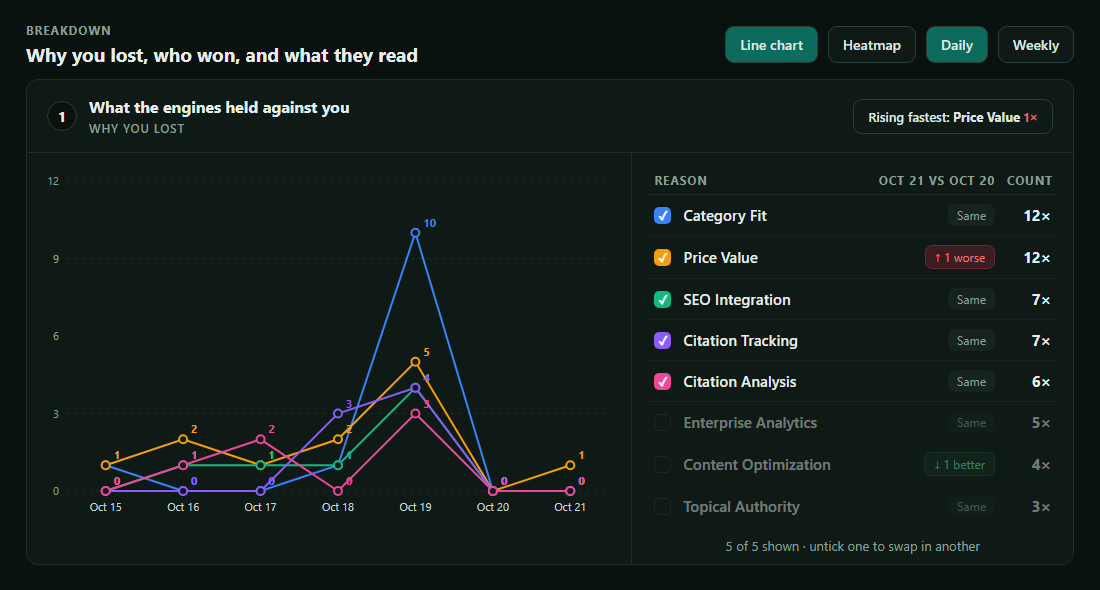
Two reasons with the same count can tell different stories. We suggest starting with the reason that is both high in count and trending worse, not just the highest count.
Step 4: See Which Competitors Took Your Place
Card 2 is headed "Competitors recommended instead of" followed by your brand's name (label "WHO WON"). It ranks the competitors the engines named in place of your brand, with a count for each, the same day-over-day column and the same tick boxes as card 1.
We left this card out of the images. Its structure matches card 1. We read it this way: note the one or two competitors that keep appearing across days, and keep them in mind when you read card 3.
Step 5: Find the Websites the Engines Relied On
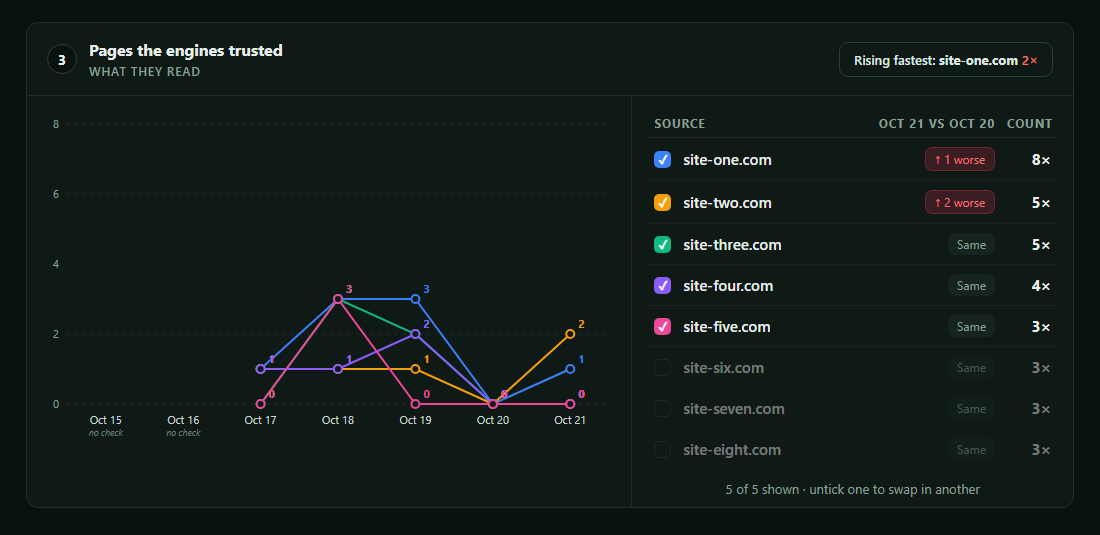
Card 3 is "Pages the engines trusted" (label "WHAT THEY READ"). It lists the sites cited in the answers that left your brand out, with the columns "SOURCE," "OCT 21 VS OCT 20" and "COUNT," plus a "Rising fastest" chip. In the example account, the most-cited site appeared 8 times over the week, then 5, 5, 4 and 3 for the next four. Three more rows were unticked.
AI answers draw on several sources at once. Google Search Central's "AI features and your website" (opens in a new tab) (last updated 10 December 2025) says Google's AI features may issue multiple related searches across subtopics and data sources, pulling in a wider set of pages than a standard search. It adds that being indexed and eligible to appear in Google Search with a snippet is required, but does not guarantee inclusion. That describes Google's AI features only, not other assistants.
We read the sites in card 3 this way: one that appears repeatedly across several days is a stronger candidate for outreach or a content pitch than one that appeared once.
Step 6: Turn the Findings into a Plan
The section "YOUR ACTION PLAN" ("5 pages to win back, in order") lists five pages. Each item has a rank, a recommended action in bold, a one-line reason stating how the AI answer used that page, the page address, up to three theme tags, a "lost answers" count and a button.
In the example account, the first three items showed 8, 5 and 5 lost answers. Their recommended actions asked for a product page that documents a set of capabilities, a clear pricing page and plan summary, and an evidence-backed write-up of how the product compares on stated criteria. Each of the first three ended with a "Draft outreach" button. An item for the brand's own page ended with "Suggest edits."
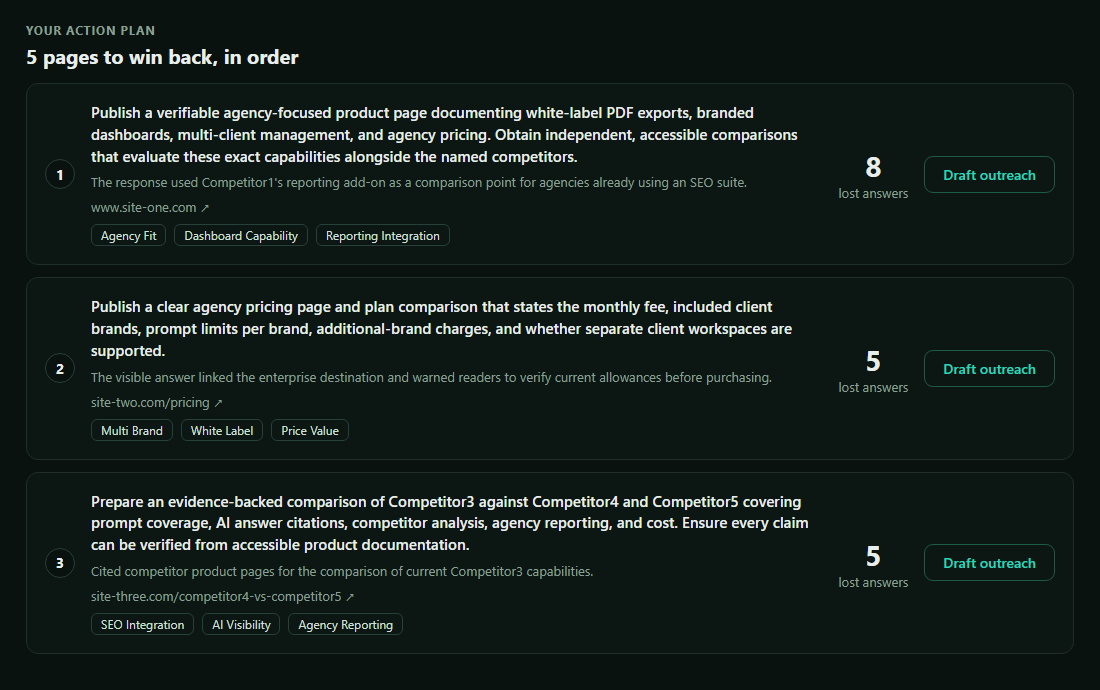
We suggest pairing the item with the highest "lost answers" count with the reason from card 1 that appeared most often. Together they point to one piece of work. The plan does not publish anything automatically: every recommendation needs team review before you act on it.
What Should You Do After the Analysis?
Pick one reason from card 1 and one site from card 3, then work through the action plan one item at a time. This routine is our suggestion, not a feature prescription.
- This week: choose the reason from card 1 that appeared across several days, not just the spike day. Pair it with the highest-count site from card 3. That is your first brief: one page to target, one gap to close.
- The next few weeks: work through the action plan one item at a time, starting with the highest "lost answers" count.
- Later: open the same date range and read the same three cards. Counts will not change overnight. Compare after a few weeks, and treat a change as something to look into, not proof that the work landed.
What Are the Limits of Exclusion Analysis?
It shows what was observed in specific captured answers, not every possible answer to a question. The feature page states three limits plainly:
- Scope. An exclusion applies to a specific captured answer. The page shows what was observed.
- Missing fields. A blank citation or field means it was not observed in that capture, not that it does not exist.
- Team review. A2ZReach does not publish a fix automatically. Every recommendation needs team review before anyone acts on it.
FAQ
Does one excluded answer mean my brand is doing badly?
No. A single excluded answer is one data point, and AI answers vary a lot from one run to the next. SparkToro's January 2026 research found less than a 1-in-100 chance that the same AI gives the same brand list in any two responses. The signal is a reason that shows up across several days and prompts.
Why doesn't ChatGPT recommend my brand?
There is no single reason, and the answer can change from run to run. Exclusion analysis lists the reasons the engines gave in the answers that left you out. In the example account these included category fit and price value. A reason that repeats across days is the one to look at first.
Does exclusion analysis publish fixes for me?
No. A2ZReach records the reasons, the competitors and the cited sites. Each recommended action needs your team's review before anything goes live.
See an Exclusion Analysis for Yourself
The fastest way to understand the page is to look at one. Our public sample report uses illustrative example data, labeled "Dataset: Illustrative example, not a real measurement of any brand." Its layout differs from the live page, but its "Diagnose Exclusions" tab walks through example prompts, the competitors recommended, the exclusion gap and a recommended action. If you would rather talk it through, book a live demo for a 30-minute visibility review with one of our specialists.
- Americans and AI 2026: Chatbots, Smart Devices and Views on Impact (opens in a new tab) Pew Research Center, June 17, 2026 · pewresearch.org · 5,119 U.S. adults; the 2024 comparison is not exact
- Gartner Survey Finds Only One-Third of Consumers Say GenAI Rivals Search Engines (opens in a new tab) Gartner, January 20, 2026 · gartner.com · 377 U.S. consumers, June and July 2025
- New Research: AIs are highly inconsistent when recommending brands or products (opens in a new tab) SparkToro, Jan 27, 2026 · sparktoro.com · not peer-reviewed; disclosed conflict of interest
- Google users are less likely to click on links when an AI summary appears (opens in a new tab) Pew Research Center, July 22, 2025 · pewresearch.org · 900 U.S. adults, Google only
- AI features and your website (opens in a new tab) Google Search Central, December 10, 2025 · developers.google.com · Google's guidance, not a guarantee